Introduction
After «my PhD in 3 seconds», «all the Britannica Encyclopedia in 20 lines» and «the foundations of rationality of the human individual by Schopenhauer and Nietzsche in less than 120 signs», here is a very very short presentation in 10 minutes plus 5 minutes of interactive session using R with a strong inclination towards bioinformatics.
It is, of course, neither educational nor falsely useless, event if it ressembles a little bit to a theatrical show.

1. Very very short presentation of R
R is a free scriptable and programmable software available for Windows, MacOs and Linux. It is exhaustively complete for everything that refers to statistics, which includes, in our conception, biostatistics and bioinformatics.
In R, you will find :
-
hundreds of base commands;
-
the possibility to concatenate commands and to automate the computations within scripts;
-
thousands of ready to use data, even for genomics and metagenomics;
-
data structures adapted to statistics, biostatistics and to bioinformatics: vectors, arrays, matrices, lists, "data frames", time series, statistical models...;
-
execution environnements with or without menus, with automated or partially automated production of HTML, Word, LaTeX or PDF documents;
-
thousands of functions that are already tailored to classical computations and the possibility to define (program) as many new more functions as you want or need;
-
high quality graphics designed for articles, posters and all kinds of publications;
-
a structured organization in packages and in "tasks" to [try to] find your way around;
-
references manuals, users' guides documentations in PDF named vignettes and "real" books (Springer, CRC...);
-
millions of users and professionals, blogs, reference web sites, moocs, videos, lectures, conferences...
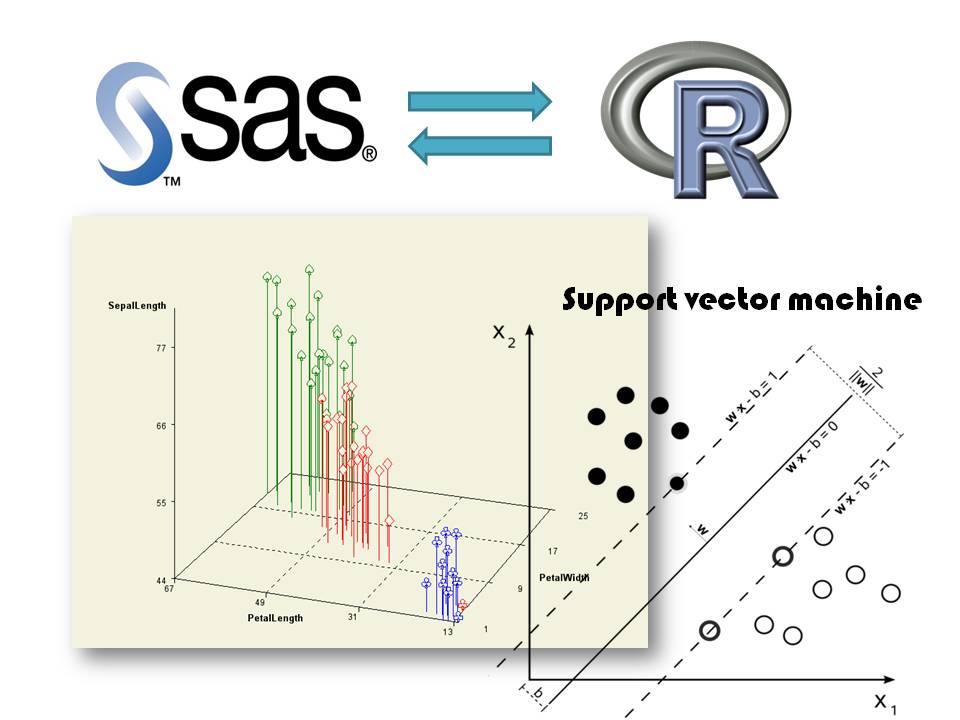
2. R and bioinformatics including metagenomics
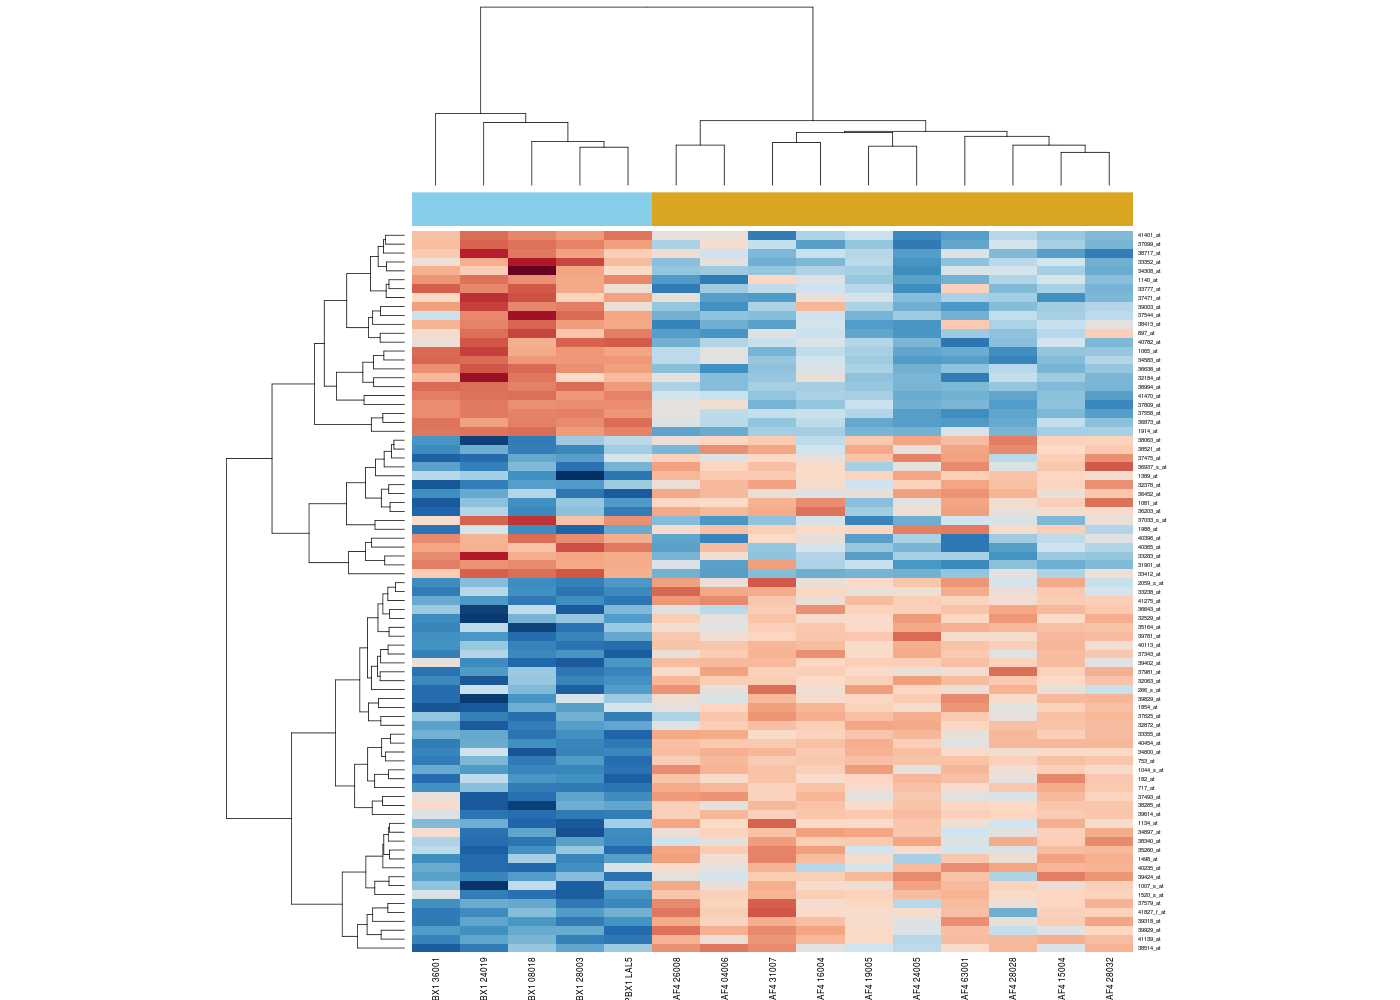
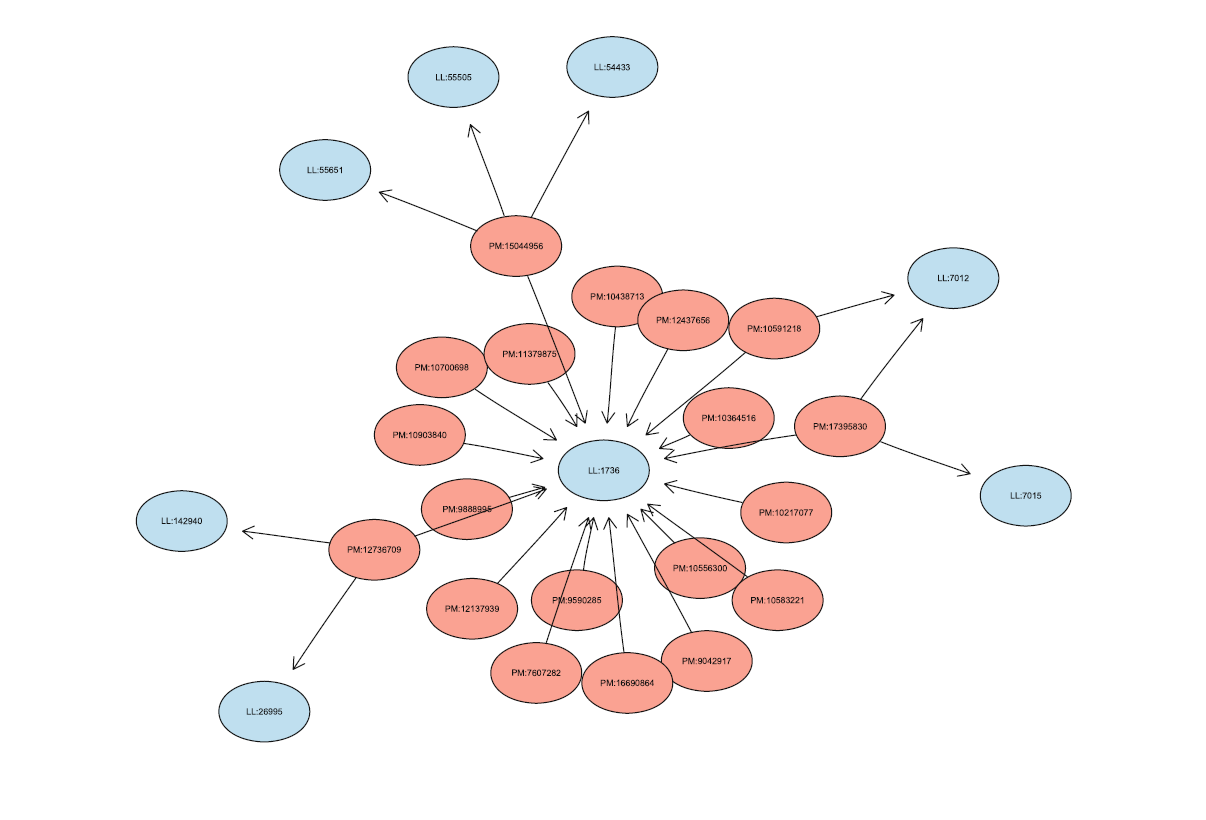
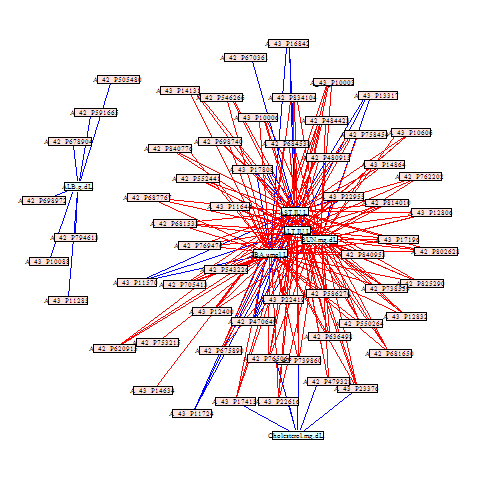
Bioinformatics analyses spread over a very large spectrum of computations, methods and techniques, whether it is building sequences alignments, the creation of phylogenetic trees, the vizualisation of the results using heatmaps, the differential expression of genes, the analysis of interactions networks or genes networks, the prediction of structures, the genetics of populations, the simultaneous representation as bigraphs of genes and PubMed articles, the computation of genomic distances, euclidian or not...
R suits really well this kind of computations and analyses because R is a rather open language that can be easily interfaced with command line executable programs. Moreover, the graphical possibilities of R and its ability to read files over the Internet allows it to access dynamically to the huge world wide biological data bases of NCBI, EBI, UNIPROT... without forgetting its dedicated site to bioinformatics named Bioconductor.
Moreover R is up to date for everything that deals with what is called «Big Data», whether it is False Big Data, also named Statistical Big Data (let's say less than 100Gb of data, but with data tables of dimension (n,p) with p>>n) or True Big Data, for which data can not be put in the main memory of only one computer, and that requires several computers, several servers organized in a cluster or a grid.
At last, centralization and readiness of computations, data, examples and help files make R an unrivalled interactive laboratory full of bioinformatics tools event if the Python language, being more general, is a serious and efficient competitor, especially if you already know how to program...
3. References about R, limited and bioinformatics oriented (on purpose)
If, on the Web, you look for expressions such as
bioinformatics, "with R", "using R" and books or filetype:pdf you will find numerous books, sometimes published by well known editors, other times only available on the Web,
as you can check below.
Here are my favorites :
4. Demos with examples via R using RStudio (live)
Here is an easy to read R script to read and count and then analyze the number of nucleotides for the gene X94991. It is of course R that reads at the NCBI the sequence of the gene via Internet (all that begins with # is a comment and is therefore ignored by R):
     #############################################
     #                                           #
     # comptage des nucléotides du gène X94991   #
     #                                           #
     #############################################
     #
     # pour le GBSA          (gH). novembre 2015 #

     library(ape)                                        # chargement de la librairie
     geneX <- read.GenBank("X94991.1",as.character=TRUE) # lecture du gène demandé
     cnt <- table(geneX)                                 # comptages par type de nucléotide
     print( cnt )                                        # affichage
     print(chisq.test(cnt))                              # calcul du chi-deux d'adéquation
Hereis the result of the execution
     geneX
       a   c   g   t
     410 789 573 394

     Chi-squared test for given probabilities
     data:  cnt X-squared = 187.07, df = 3, p-value < 2.2e-16
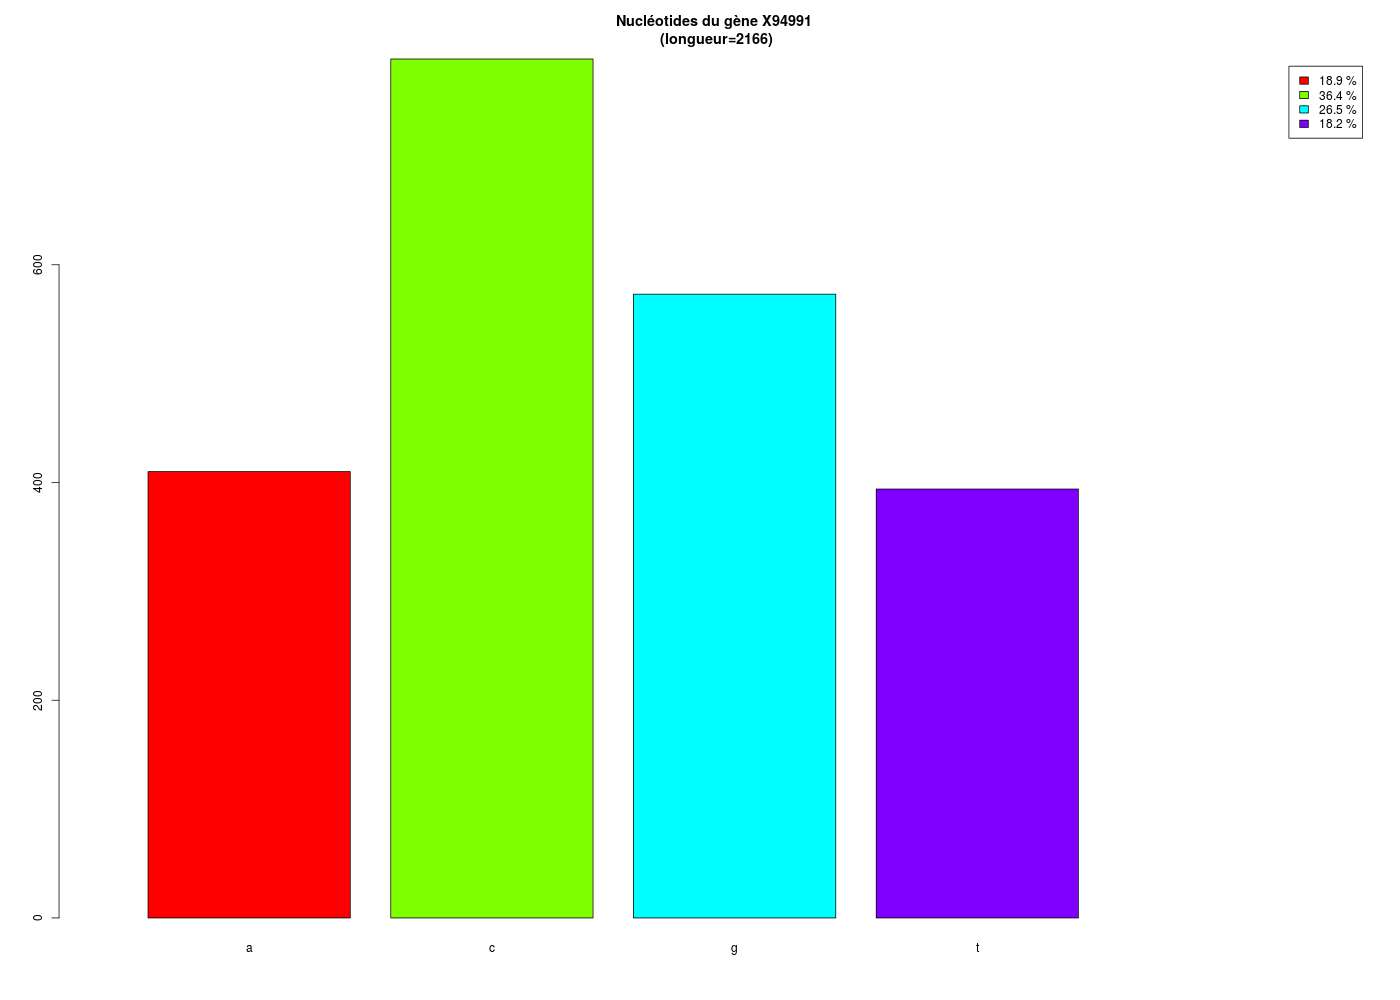
With the help of a few more commands, one can have a better display and a graphical output for the counts:
     #############################################
     #                                           #
     # comptage des nucléotides du gène X94991   #
     # puis pourcentages et graphiques           #
     #                                           #
     #############################################
     #
     # pour le GBSA          (gH). novembre 2015 #

     # tri à plat des nucléotides du gène

     tap <- table(geneX)

     # répartition détaillée des nucléotides

     props        <- as.numeric(prop.table(tap))
     pcts         <- paste(round(100*props,1),"%")
     dfRes        <- data.frame(tap,props,pcts)
     names(dfRes) <- c("Nucléotides","Comptages","Proportions","Pourcentages")

     print(dfRes)

     # visualisation graphique

     lng   <- sum(tap)
     coul  <- rainbow(dim(tap)) # mieux que c("red","green","blue","yellow")
     titre <- paste("Nucléotides du gène X94991\n (longueur=",lng,")",sep="")

     barplot(tap,main=titre,col=coul,legend.text=pcts,xlim=c(0,6))
This is what we get:
       Nucléotides Comptages Proportions Pourcentages
     1           a       410   0.1892890       18.9 %
     2           c       789   0.3642659       36.4 %
     3           g       573   0.2645429       26.5 %
     4           t       394   0.1819021       18.2 %
Then, if you know a little bit of R programming, you can add some explanations and automatize the computations with some general functions for students and basic users:
     #############################################
     #                                           #
     # comptage des nucléotides du gène X94991   #
     # calcu du chi2 d'équirépartition           #
     #                                           #
     #############################################
     #
     # pour le GBSA          (gH). novembre 2015 #

     # un chi-deux détaillé en français avec conclusion automatique
     # issu des fonctions du "p'titgros"
     # disponibles à l'adresse
     #   http://www.info.univ-angers.fr/~gh/wstat/statghfns.php

     source("http://forge.info.univ-angers.fr/~gh/wstat/statgh.r",encoding="latin1")

     # réalisation du chi-deux et explications en français

     # il s'agit ici du chi-deux d'adéquation à une distribution théorique
     # (de même effectif global) soit ici la loi uniforme discrète,
     # autrement dit, la loi sous hypothèse d'équirépartition

     chi2Adeq(vth=rep(length(geneX[[1]])/4,4),vobs=tap,graph=TRUE)
      CALCUL DU CHI-DEUX D'ADEQUATION

      Valeurs théoriques   541.5 541.5 541.5 541.5
      Valeurs observées    410   789   573   394
      Valeur du chi-deux   187.0674

      Chi-deux max (table) à 5 %  7.814728 pour   3  degrés de liberté ; p-value  2.62465e-40

      décision : au seuil de  5 % on peut rejeter l'hypothèse
      que les données observées correspondent aux valeurs théoriques.
Atlas, with the help of well chosen Markdown commands -- for example if you add a the beginning of the
     ---
     title: bRavo !
     output: all
     ---
     # un exemple vite fait
     ```{r}


     [...] ici le code R précédent
then with only one clic you get the following files :
You can check all this by running the following file genex04.rmd
     ---
     title: "demoR15"
     output: all
     ---

     # Gène X94991

     ```{r}
     library(ape)                                        # chargement de la librairie
     geneX <- read.GenBank("X94991.1",as.character=TRUE) # lecture du gène demandé
     cnt <- table(geneX)                                 # comptages par type de nucléotide
     print( cnt )                                        # affichage
     print( cnt )                                        # affichage
     ```

     # Histogramme des fréquences

     ```{r, echo=FALSE}
     # répartition détaillée des nucléotides

     tap <- table(geneX)
     props        <- as.numeric(prop.table(tap))
     pcts         <- paste(round(100*props,1),"%")
     dfRes        <- data.frame(tap,props,pcts)
     names(dfRes) <- c("Nucléotides","Comptages","Proportions","Pourcentages")
     print(dfRes)

     # visualisation graphique

     lng   <- sum(tap)
     coul  <- rainbow(dim(tap)) # mieux que c("red","green","blue","yellow")
     titre <- paste("Nucléotides du gène X94991\n (longueur=",lng,")",sep="")

     barplot(tap,main=titre,col=coul,legend.text=pcts,xlim=c(0,6))
     ```
     # Avec les fonctions (gH)
     ```{r,echo=FALSE,print=FALSE}
     source("http://forge.info.univ-angers.fr/~gh/wstat/statgh.r",encoding="latin1")
     ```
     ```{r}
     # réalisation du chi-deux et explications en français

     # il s'agit ici du chi-deux d'adéquation à une distribution théorique
     # (de même effectif global) soit ici la loi uniforme discrète,
     # autrement dit, la loi sous hypothèse d'équirépartition

     chi2Adeq(vth=rep(length(geneX[[1]])/4,4),vobs=tap,graph=TRUE)
     ```
5. Short summary : pros and cons of R
Pros of R
Very nice statistical tool, free, complete, well documented and well suitable for bioinformatics, research publications and for reproducible research because you don't have to cut and paste results into your articles.
Cons of R
Not so easy to master in a short time. Needs to (but is it really a con?) program to be very efficient.
A few good news
(to survive R!)
To end this presentation, four good news to avoid being all in the same galley with R:

-
The site names Datajoy allows to use R via a Web interface, without any installation.
-
The sites try.codeschool and datacamp deliver self-learning R courses, if the numeros videos and tutorials about R on the Web are not sufficient for your needs.
-
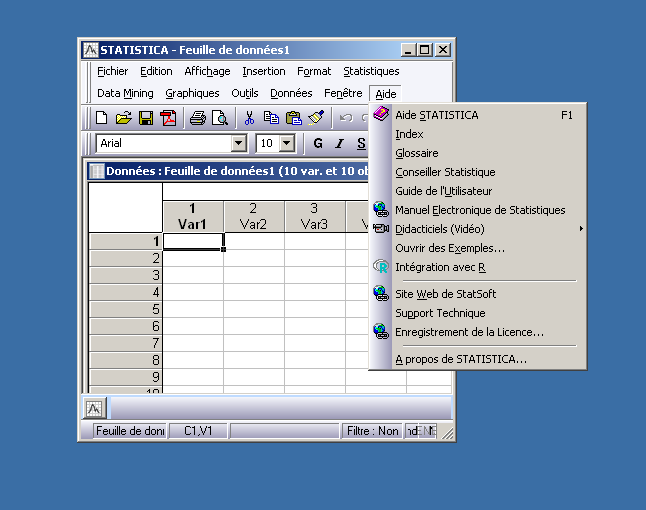
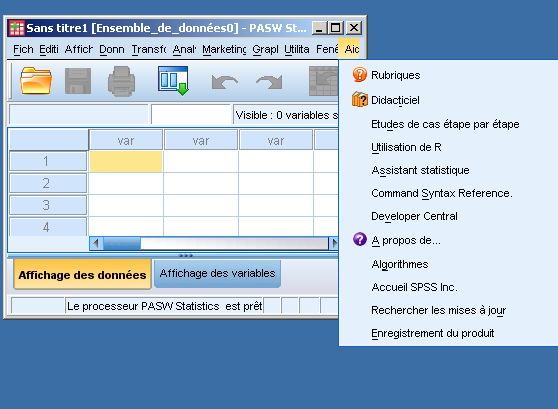
Since many years (precisely from 2011 on), Statistica and SPSS have integrated R in their software; SAS even uses R via SAS/IML :
-
My teachings include R courses for engineers, PhD and post PhDstudents with more than 50 people per year.
For example you can visit the (French) pages EDA biostats and progR.
Feel free to see also the page R for biostatistics in just 5 minutes (!) .
|


 Retour à la page principale de
(gH)
Retour à la page principale de
(gH)