R for biostatistics in just 5 minutes (!)
gilles.hunault "at" univ-angers.fr
Attention:
this is the continuation of R15
so read first the page R15
There is a French version available here.
Clickable table of contents
1. Why R for biostatistics?
2. References limited and biostatistics oriented
3. Short demo via Datajoy
4. Short demoS via RStudio
1. Why R for biostatistics?
All that have been written in favor of R for bioinformatics is also adapted to R for biostatistics: R is free and exhaustively complete for everything that refers to biostatistics. Moreover, because R has been created for statistics in general, all recent and new statistical methods are available in R, as opposed to the classical statistical software such as SAS, SPSS or Statistica.
2. References limited and biostatistics oriented
In opposition to books dedicated to bioinformatics with R, there is a plethora of books dedicated to biostatistics with R (click on the image):

If you look on the Web expressions such as
biostatistics, "with R", "using R" and books or filetype:pdf you will find thousands (yes, thousands) of books, sometimes published by notorious editors, othertimes only stored on the Web,
as you can check below.
3. Short demo via Datajoy
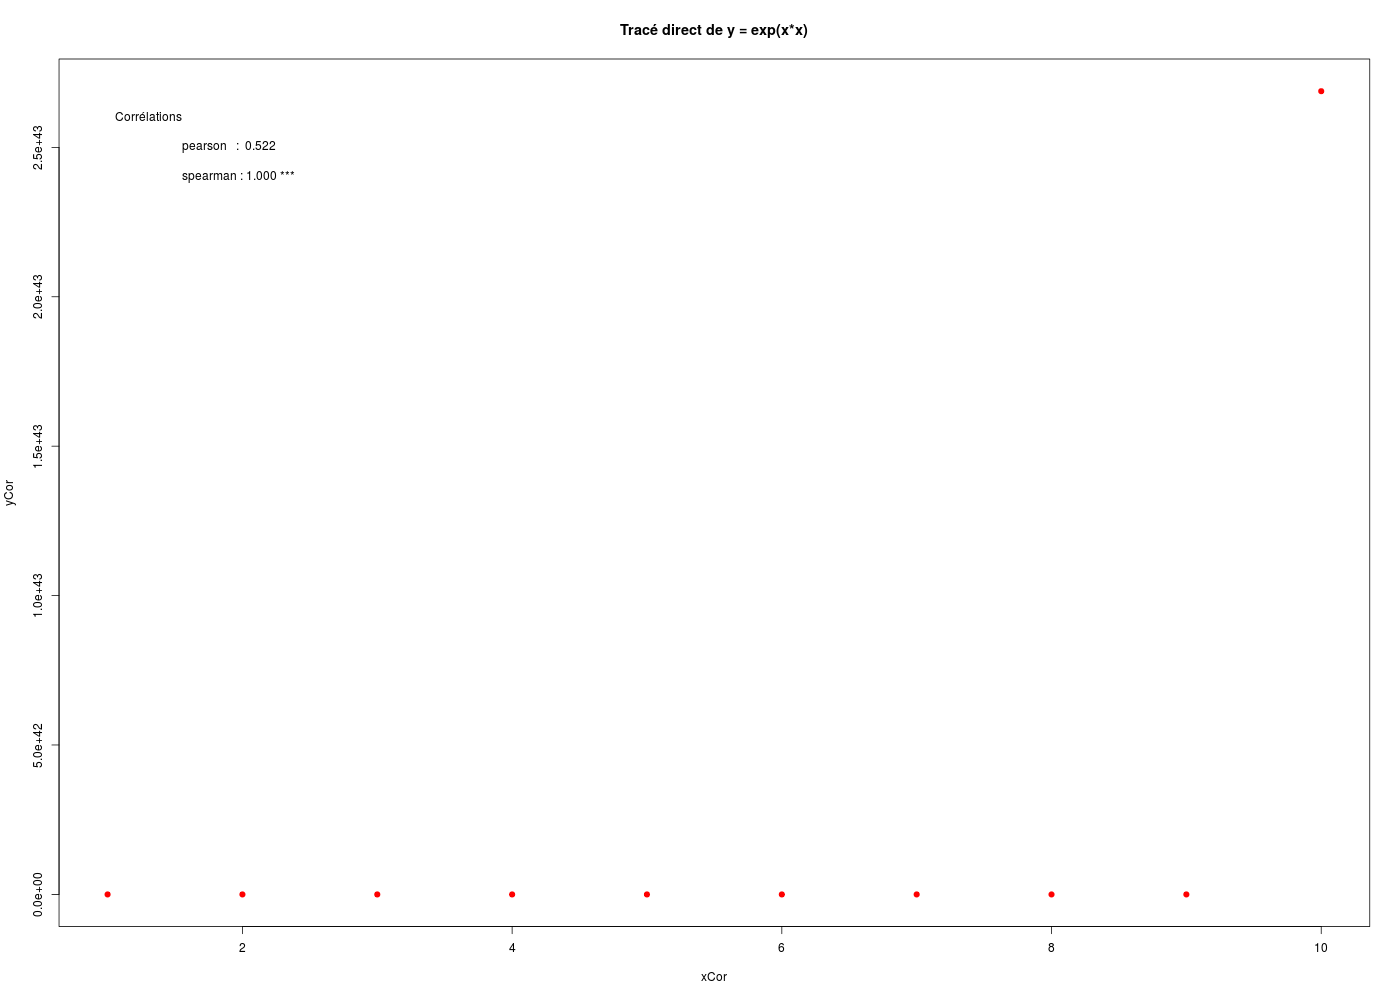
Here is a short easy to read R text to show the difference between Pearson's correlation, the classical linear correlation and Spearman's correlation, that is to say, the monotonous rank correlation (all that begins with # is a comment, ignored by R):
      cat("Calculs de coeficients de corrélation\n")

      # x et exp(x*x) sont liés mais pas linéairement

      xCor <- 1:10
      yCor <- exp(xCor*xCor)

      # donc la corrélation au sens de Pearson est faible

      corp  <- cor(xCor,yCor,method="pearson")
      corpf <- sprintf("%0.3f",corp)
      pvcp  <- cor.test(xCor,yCor,method="pearson")$p.value
      cat(" pearson  : ",corpf)
      cat(" ; p-value = "   ,sprintf("%0.3f",pvcp),"\n",sep="")

      # alors que celle de Spearman est au maximum

      cors  <- cor(xCor,yCor,method="spearman")
      corsf <- sprintf("%0.3f",cors)
      pvcs  <-  cor.test(xCor,yCor,method="spearman")$p.value
      cat(" spearman : ",corsf)
      cat(" ; p-value = ",sprintf("%0.3f",pvcs),"\n",sep="")
      cat("\n")

      # vérifications par le tracé

      titre <- "Tracé direct de y = exp(x*x)"
      plot(xCor,yCor,main=titre,pch=19,col="red")
      text(x=1.0,y=2.6*10**43,pos=4,adj=4,labels="Corrélations")
      text(x=1.5,y=2.5*10**43,pos=4,adj=4,labels=paste("pearson   : ",corpf))
      text(x=1.5,y=2.4*10**43,pos=4,adj=4,labels=paste("spearman :",corsf,"***"))

      # données utilisées

      cat("Voici les valeurs de x et de y\n")
      print(cbind(xCor,yCor),row.names=FALSE)
The result of the execution is:
     Calculs de coeficients de corrélation
      pearson  :  0.522 ; p-value = 0.122
      spearman :  1.000 ; p-value = 0.000

     Voici les valeurs de x et de y
           xCor         yCor
      [1,]    1 2.718282e+00
      [2,]    2 5.459815e+01
      [3,]    3 8.103084e+03
      [4,]    4 8.886111e+06
      [5,]    5 7.200490e+10
      [6,]    6 4.311232e+15
      [7,]    7 1.907347e+21
      [8,]    8 6.235149e+27
      [9,]    9 1.506097e+35
     [10,]   10 2.688117e+43
And the clickable curve is (please note the values on the Y-axis):
A simple cut-and-paste of the above R code in the site Datajoy allows youto check all this by yourself without installating R.
4. Short demoS via RStudio
A very strong and important feature of R is its reactivity. For instance, there is in R a package named survivalROC for time depending AUROCS, which are recent computations, that neither SAS, SPSS or Statistica are able to compute. A look at this link every day will suffice to check which package is updated ou newly avaliable. That shows that R is evolving very quickly, when SAS, SPSS and Statistica release an update of their software at most once a year, and even, without a lot of new changes. Moreover, to install a new package in R takes a few seconds (in the worst case a few dozen of de seconds) with Rstudio so everything in available in R as soon as you need it.
Another noticeable point today (2016) is its ability to deliver reproductible research with the least costs for every user. For example, the following text, that uses the Markdown format, leads to the production, thanks to these two easy to modify instructions output: pdf_document and nbp <- 10, of the parametrized document demor5Biostats.pdf.
If you change the two instructions into output: word_document and nbp <- 8, then R produces, instead of a PDF file, the following Word file demor5Biostats.docx. At last, if you change them to output: html_document et nbp <- 20, then R gives you the following Web page demor5Biostats.html.
So, in less that 10 seconds (the time you need to change output: and nbp and to re-run the code) R is able to deliver different external documents with the required parametrization.
You can imagine how easy it is to automate a report analyses of date in Excel files for an article or a publication without having to cut/paste results... What a saving of time! Who is against not having any more to transfer results from a statistical software to one's favorite word processing system and to use its time to more "clever"activities?
|
 Retour à la page principale de
(gH)
Retour à la page principale de
(gH)