![]()
![]()
A simple imperfect gold standard computationgilles.hunault "at" univ-angers.frReference
Programmed formula
|
 Retour à la page principale de
(gH)
Retour à la page principale de
(gH)


A simple imperfect gold standard computation
gilles.hunault "at" univ-angers.fr
Reference
Exceeding the limits of liver histology markers
Shruti H. Mehta, Bryan Lau, Nezam H. Afdhal, David L. Thomas
Journal of Hepatology, Volume 50, Issue 1, January 2009, Pages 36-41.
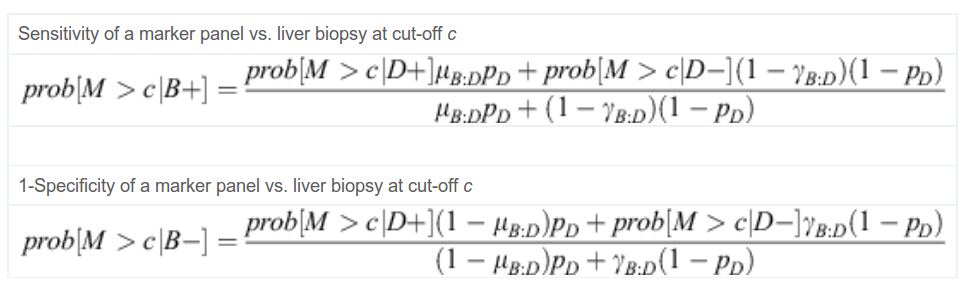
Programmed formula
D+ and D denote the true stage of disease; B+ and B indicate biopsy diagnosed disease; M denotes the value on a continuous scale of a marker; μB:D and γB:D are the sensitivity and specificity of the biopsy relative to true disease, respectively; pD is be the prevalence of true disease.
prob[ M>c | D+ ] and prob[ M>c | D- ] are the sensitivity of marker vs. true disease at cut-off c and 1-specificity of marker vs. true disease at cutoff c.
For example, for a perfect marker panel where the sensitivity and specificity with respect to true disease are 100% (AUROC = 1), a disease prevalence of 40% and the sensitivity and specificity of the biopsy vs. true disease both equal to 90%, the observed sensitivity and specificity of the marker panel vs. biopsy will be equal to 0.86 and 0.93, respectively.